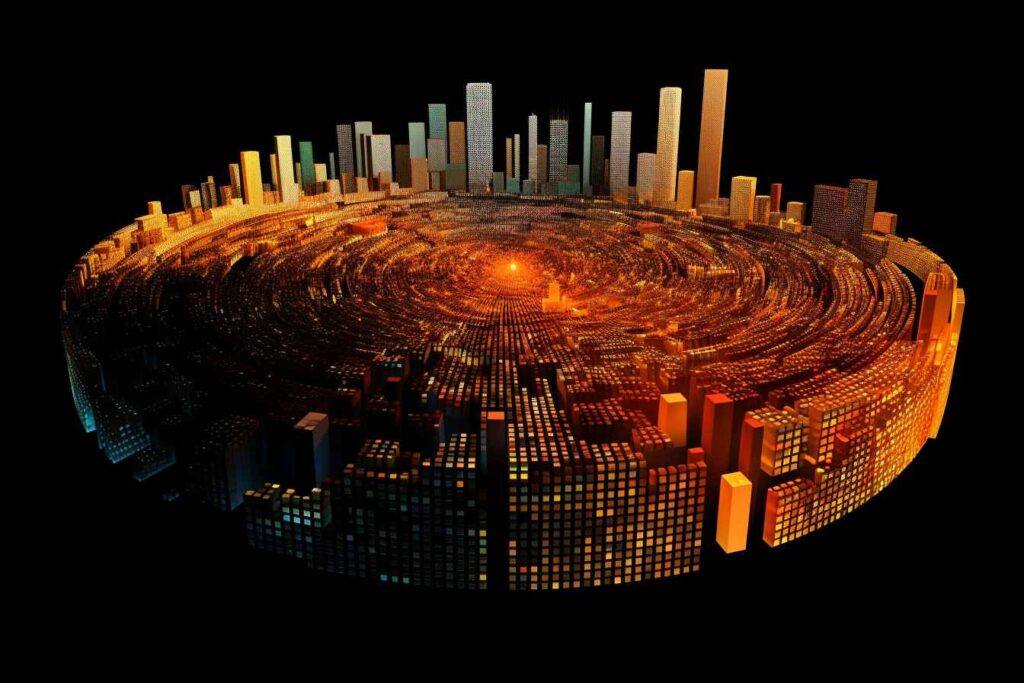
Circular Data Array Visualization
Circular Data Array Visualization is a tool that aids in the visualization of data arranged in a circular graph. The visualizations provide representations of data in an engaging and visually appealing manner, employing a range of artistic styles such as dazzling cityscapes, luminous 3D objects, rectilinear forms, and whiplash curves. Through these visualizations, users can better understand the relationships, patterns, and trends within their data, making informed decisions and gaining valuable insights.
Upgrade to a Premium account to access unlimited high-quality prompts, totaling over 50,000 and receive daily updates of new prompts.
Tips
Follow these guidelines to maximize your experience and unlock the full potential of your conversations with Prompt Snack Chat.
Because the prompt has been carefully designed and thoroughly tested, all you need to do is replace the keywords, topic, and idea, you will get perfect images
To achieve images like the demo, we suggest using Midjourney or DALL·E, Stable Diffusion, or Gemini with the latest versions. Remember to include links to these platforms.
Our Customers
Over 15,000 users have all admitted that the prompts helped them optimize their work and save a lot of time.
Similar Prompts
Discover related prompts to expand your productivity. Seamlessly connecting with ChatGPT for endless conversation possibilities.


